What is VectorDraw XBlock?
Contents
What is VectorDraw XBlock?#
This XBlock allows course authors to create vector drawing exercises within a course.
What are the benefits of using VectorDraw XBlock?#
Scalability: Vector drawings are resolution-independent, which allow users to scale them up or down without any loss of quality.
Small file size: Vector graphics generally have a small file size because they store only a small number of points and the mathematical connections between them. Code represents these connections, consuming less memory than saving individual pixels.
WYSIWYG Editor: Course creators have the option to use a WYSIWYG Editor when configuring this XBlock. WYSIWYG, an acronym for What You See Is What You Get, is a tool that allows users to see and edit content in a form that appears as it would when displayed on an interface.
How to implement VectorDraw XBlock?#
- Step 1:
Go to Studio. Remember, you can access it through the link in your ECC account or by going to studio.edunext.co and signing in with your email and password.
- Step 2:
Open the course where you will add the Vectordraw XBlock.
- Step 3:
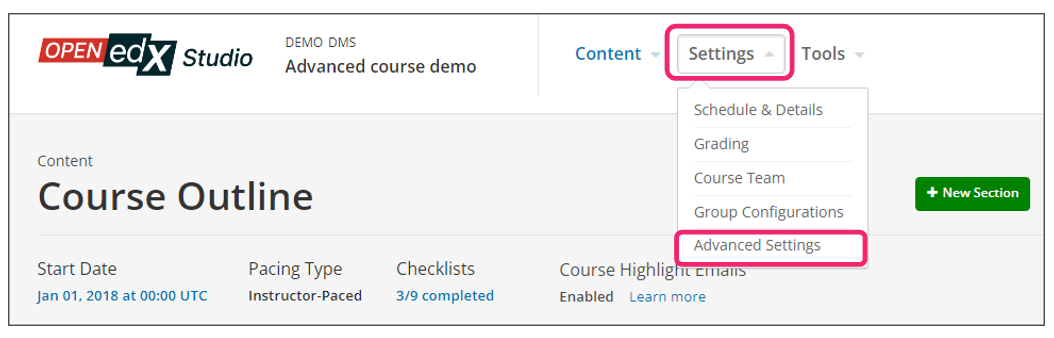
Click on the Settings tab and select the Advanced Settings option.
- Step 4:
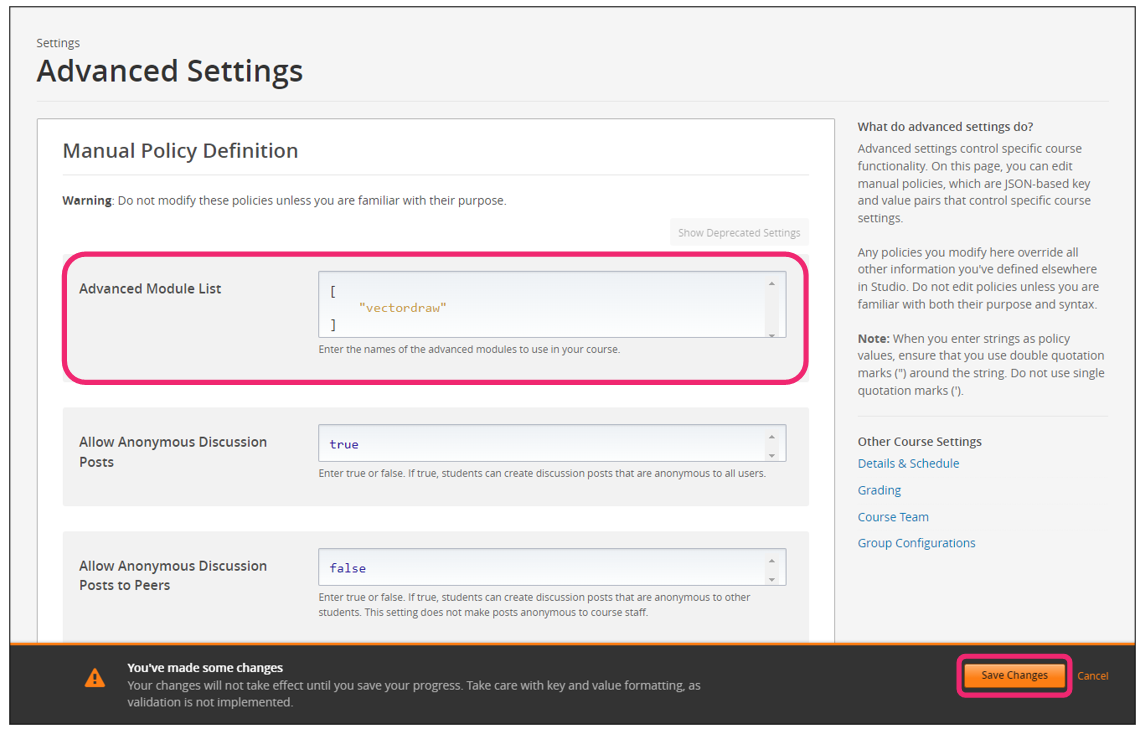
In the section Advanced Module List, add
vectordrawbetween the square brackets.[ "vectordraw" ]
Note
Add the XBlock command with an indented space without any space before or after quotation marks, as shown in the example above, to avoid execution errors.
- Step 5:
At the bottom of the screen, click on Save Changes.
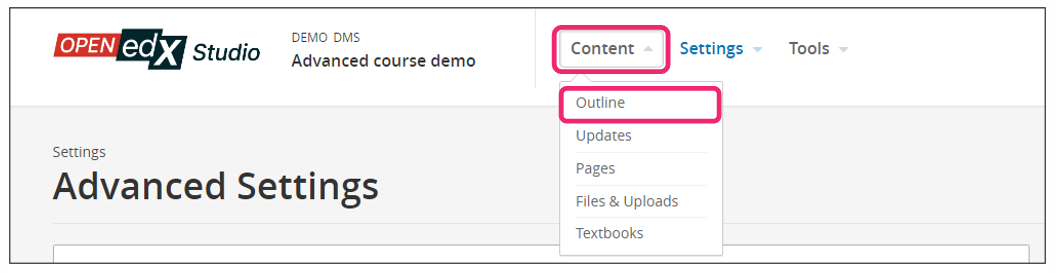
- Step 6:
After this, the XBlock should be available, so click the Content tab and select the Outline option to get back to the course content.
- Step 7:
Under Outline, go to the section, then the subsection, and finally to the unit or page where you want to add the Vectordraw XBlock.
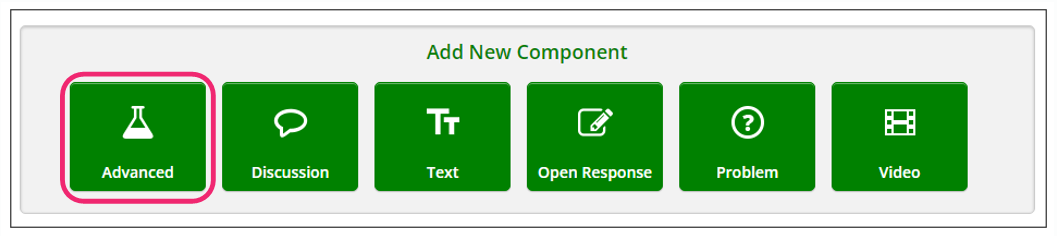
- Step 8:
Once you are there, click Advanced Component in the Add New Component bar.
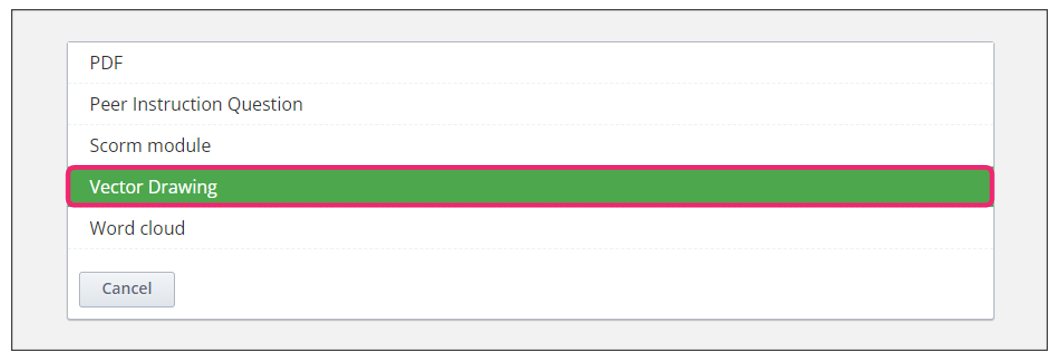
- Step 9:
You will see a list of all the advanced components added to your course. Click on Vector Drawing. The system will add the component immediately to the unit.
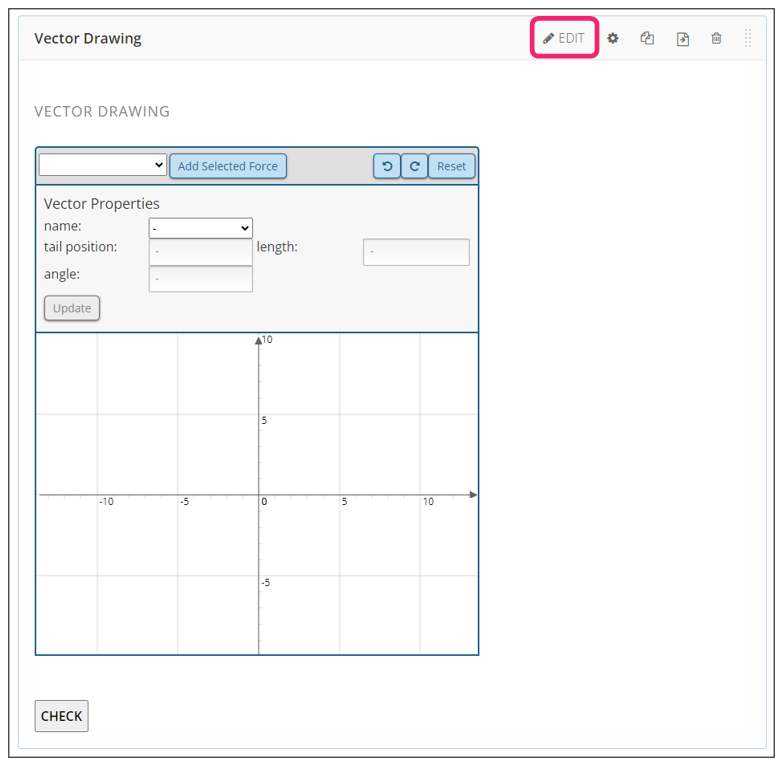
- Step 10:
Click the Edit option to configure the XBlock as needed.
- Step 11:
The editor window is going to open. Here you will find several options to set up the XBlock as needed. The principal options that you have to edit are:
Title: Title or name of the XBlock to display.
Description: Exercise description displayed above vector drawing box.
Width: The width of the board in pixels (defaults to 550).
Height: The height of the board in pixels (defaults to 400).
Bounding box size: It defines the bounding box height of the graph area, and the bounding box width is calculated from the width/height ratio (defaults to 10).
Show axis: Configured to True as default. This will show the graph axis and the grid lines (but note that the background image might cover them). Enabling this option makes the exercise more accessible for users relying on the keyboard for manipulating vectors. Otherwise, you can select False.
Show navigation: Option to show navigation arrows and zoom controls (defaults to False).
Show vector properties: Option to show box detailing vector properties (defaults to True).
Show slope for lines: If you set it to True, it will show the slope for the line object (defaults to False).
Add vector label: Label for button that allows to add vectors to the board.
Vector properties label: Label for box that displays vector properties.
Background URL: URL for background image.
Background width: Width of background image.
Background height: Height of background image.
Background description: You can provide a description of the image for non-visual users here. The description should provide sufficient information that would allow anyone to solve the problem if the image did not load.
Vectors: List of vectors to use for the exercise. You must specify it as an array of entries where each entry represents an individual vector. Click VectorDraw Vectors for more information.
Note
You can also utilize the WYSIWYG editor to create or modify vectors. If you do, the data WYSIWYG editor will overwrite any changes you make in the Vectors box when saving.
Points: List of points to be drawn on the board for reference, or to be placed by the student. You must specify it as an array of entries where each entry represents an individual point. Click VectorDraw Points for more information.
Expected Result: Defines vector properties for grading. You must specify it as a JSON object where each key is the name of an existing vector and each value is a JSON object containing information about checks to perform and expected values. Click VectorDraw Expected Results for more information. Vectors omitted from this setting are ignored when grading.
Note
You can also use the WYSIWYG editor to opt in and out of checks for individual vectors. If you use the WYSIWYG editor at all, it will overwrite any changes you make here when saving.
Custom checks: You need to provide a list of custom checks to use for grading when grading becomes more complex and cannot be defined solely in terms of Expected results.
- Step 12:
Finish the configuration of the component and click on the Save at the bottom of editing window.
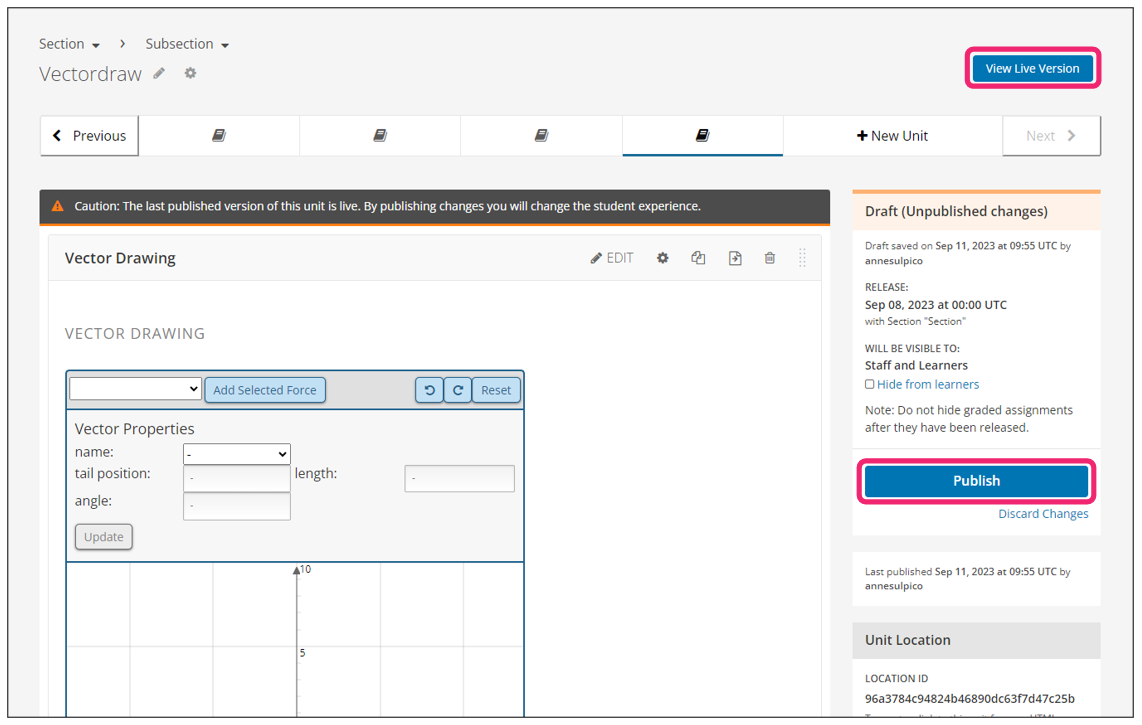
- Step 13:
Publish the unit and check how your new component looks on its final version by clicking the View Live Version button.
You may also visit our demo site where you can find an example of the VectorDraw XBlock.